
Our users are periodically asking us to instrument application code and save code coverage information after Cypress runs end-to-end tests. In this blog I will argue that code coverage is less than useful for end-to-end tests. Then I will show element coverage that might be a better metric.
Experimental featureThis document shows a very early proof of concept. The API and features shown here are likely to change. Use at your own risk.
How do you know that you have written enough tests? How do you know if every one of your existing tests is really testing the same feature, while some features are left untested? When do you know that you are done testing your application?
Having a single number - a percentage from 0 to 100 - would be ideal. If you report “app is 100% tested”, people feel confident; the application will work. Yet, the real world is more complicated. Let’s look at the popular testing metric - code coverage.
Code coverage
To get code coverage, you instrument the source code using a preprocessor like istanbul, run your tests (usually unit tests) and then save the report. The report shows how many times each line of the application’s source code was executed during the test run. Here is an example HTML report.
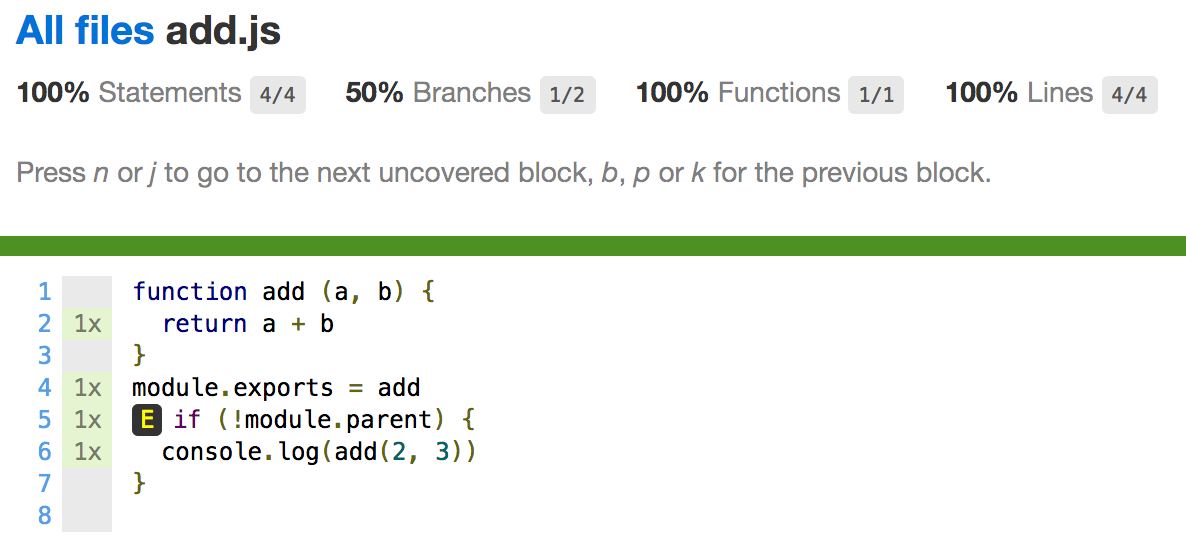
Code coverage is tricky. The report is showing that each line was executed once - see the counts 1x next to the line numbers column. Yet, the coverage report also warns us that the ELSE branch of the conditional statement if (!module.parent) has not been tested. We can spend hours chasing each path not taken, trying to increase code coverage to 100%. In fact covering these last couple of percentage points, from 90% to 100% is the hard part.
But there is a bigger problem with code coverage than chasing all execution edge cases. It is that some lines can be easily covered by the test - yet remain utterly untested. Take the email check function below as an example
const isEmail = (s) =>
  /^\w+@\w+\.\w{3,4}$/.test(s)
The above function isEmail can be 100% code covered by a single unit test
it('checks email', () => {
  expect(isEmail('foo@bar.com')).to.be.true
})
Yet, this function is obviously not going to work in the real world. Here are all valid email edge cases (I have taken these from the excellent presentation Tales from the QA Crypt by Jennifer Voss).
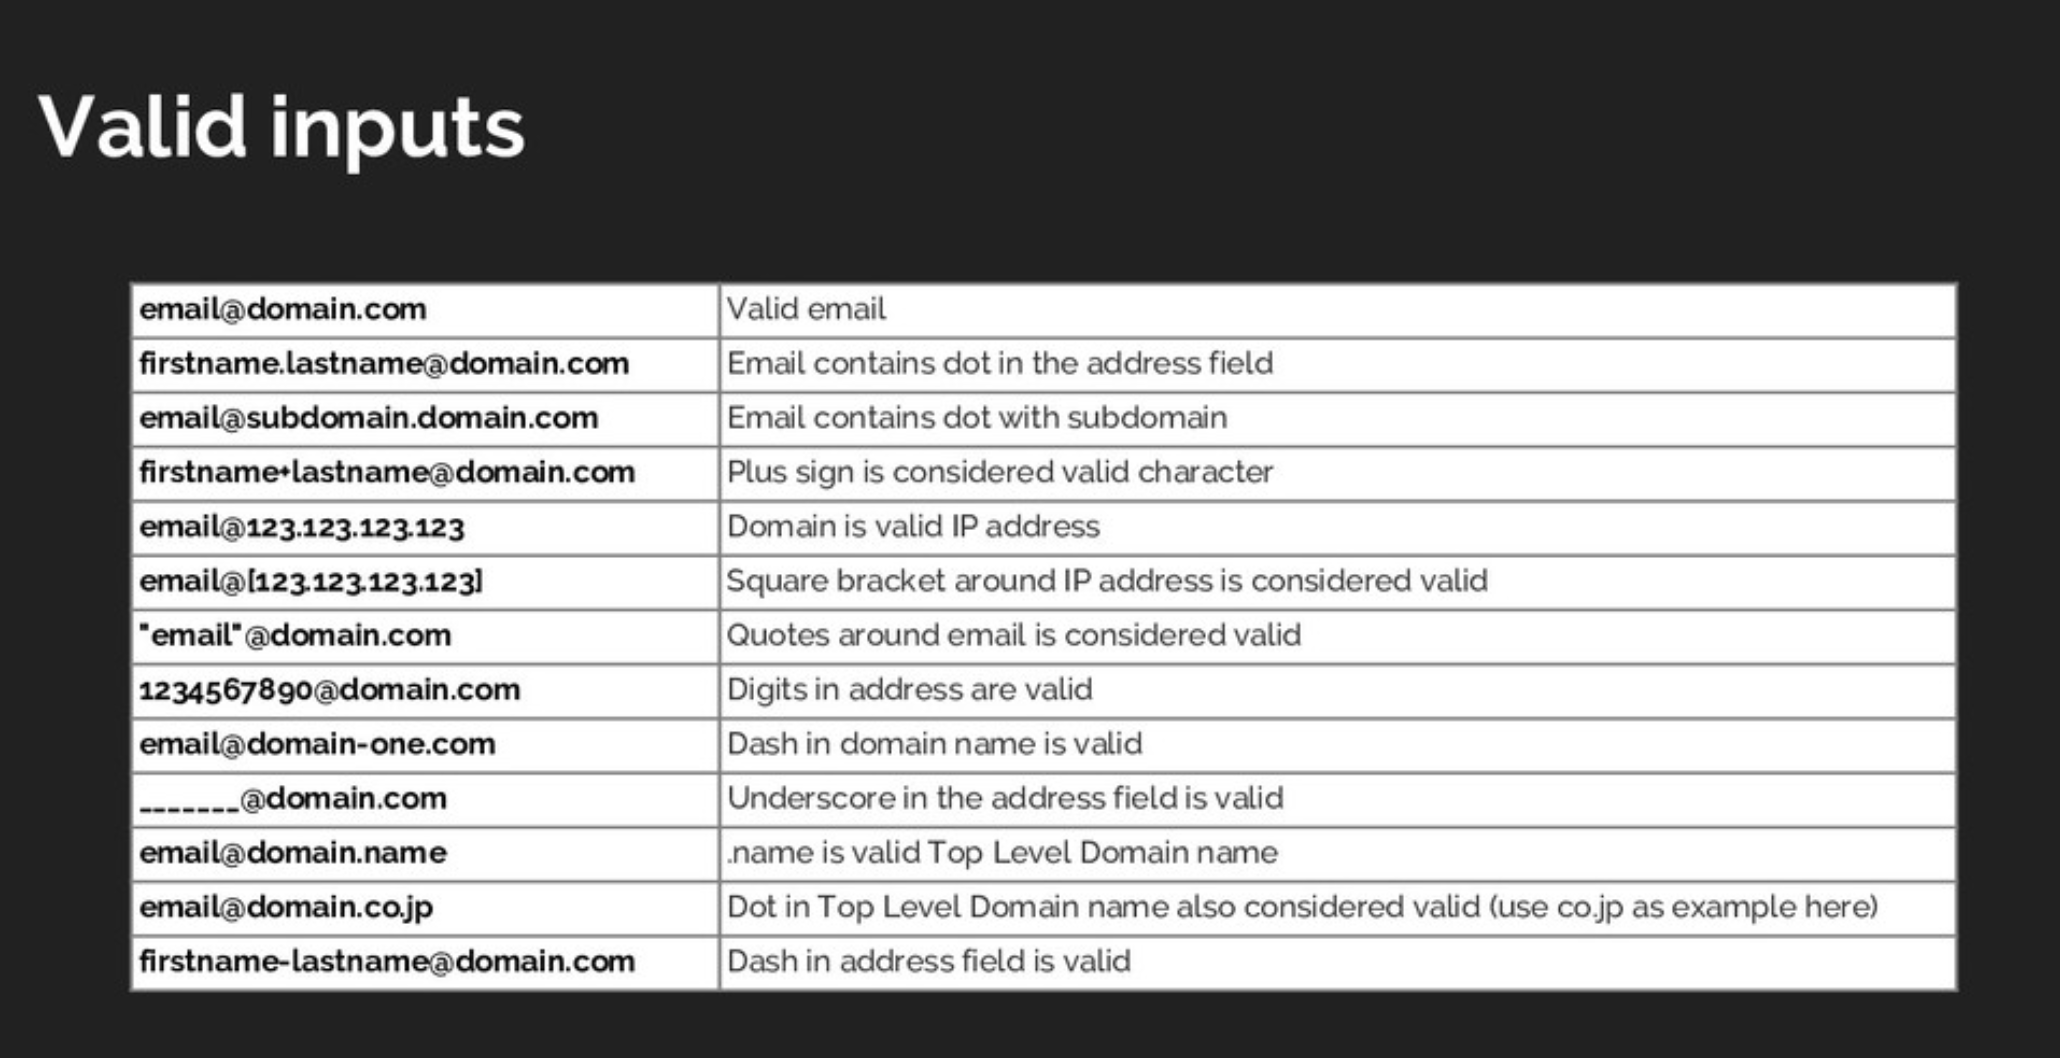
Does our function isEmail return true for the above cases? We don’t know, but I doubt it works correctly for all of them! Here are all invalid email edge cases.
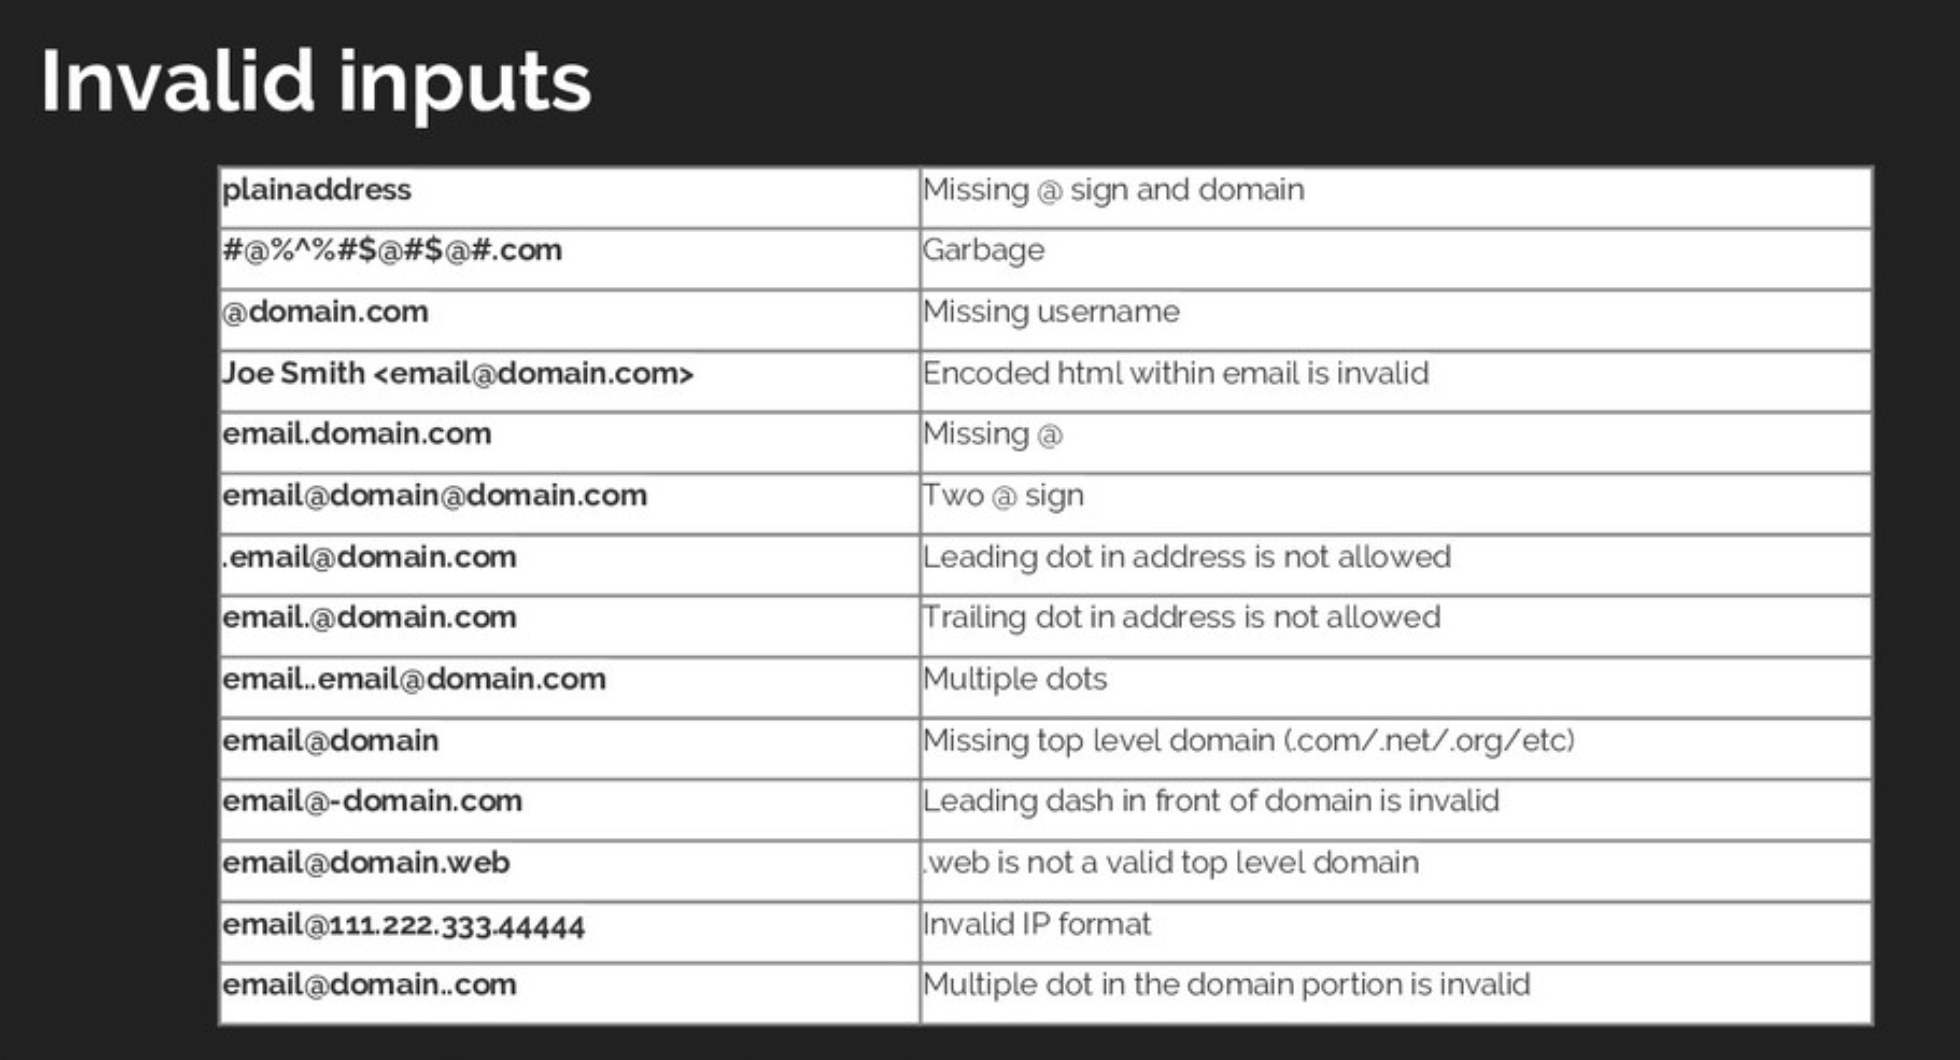
Does our function isEmail reject the above strings? I have no idea, and yet the function was 100% covered by the unit tests …
Data coverage
How well some code constructs like regular expressions work are not measured well by the code coverage. A single call to a regular expression tells us the code is covered, but does not tell us if our tests tried all the different _data _ classes and cases. So we want to see code coverage and data input coverage from our tests. The data coverage would show all the different inputs our tests exercised the function under test with.
I have even written a small utility called data-cover that instruments the code, but rather than tracking the code statements executed during testing, just collects the arguments each function has received. When the tests are finished, the tool prints the report showing all those function inputs with the function’s code.
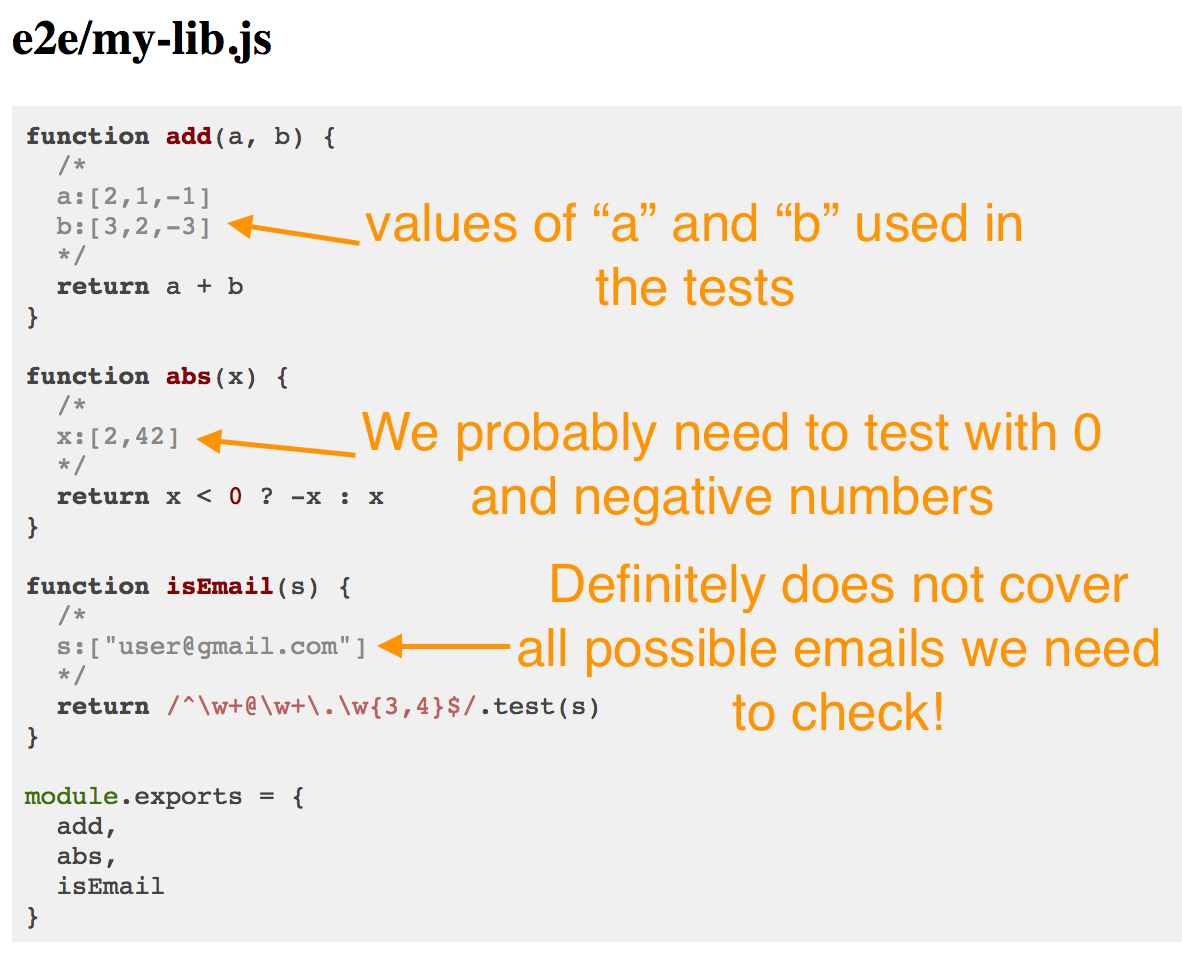
I have annotated the data coverage report with possible improvements a typical human QA might ask for after looking at the data coverage report. If we have high code coverage percentage (in our project we shoot for code coverage above 80%) and each function has been tested with a variety of data inputs, then our unit tests are really exercising the code very well.
End-to-end tests
Cypress users have been asking about code coverage for two years. Yet we do not believe code coverage is a meaningful metric for end-to-end web application tests. First, in a typical application, there is a lot of code not reachable from the user interface using “normal” means, like DOM events and network control.
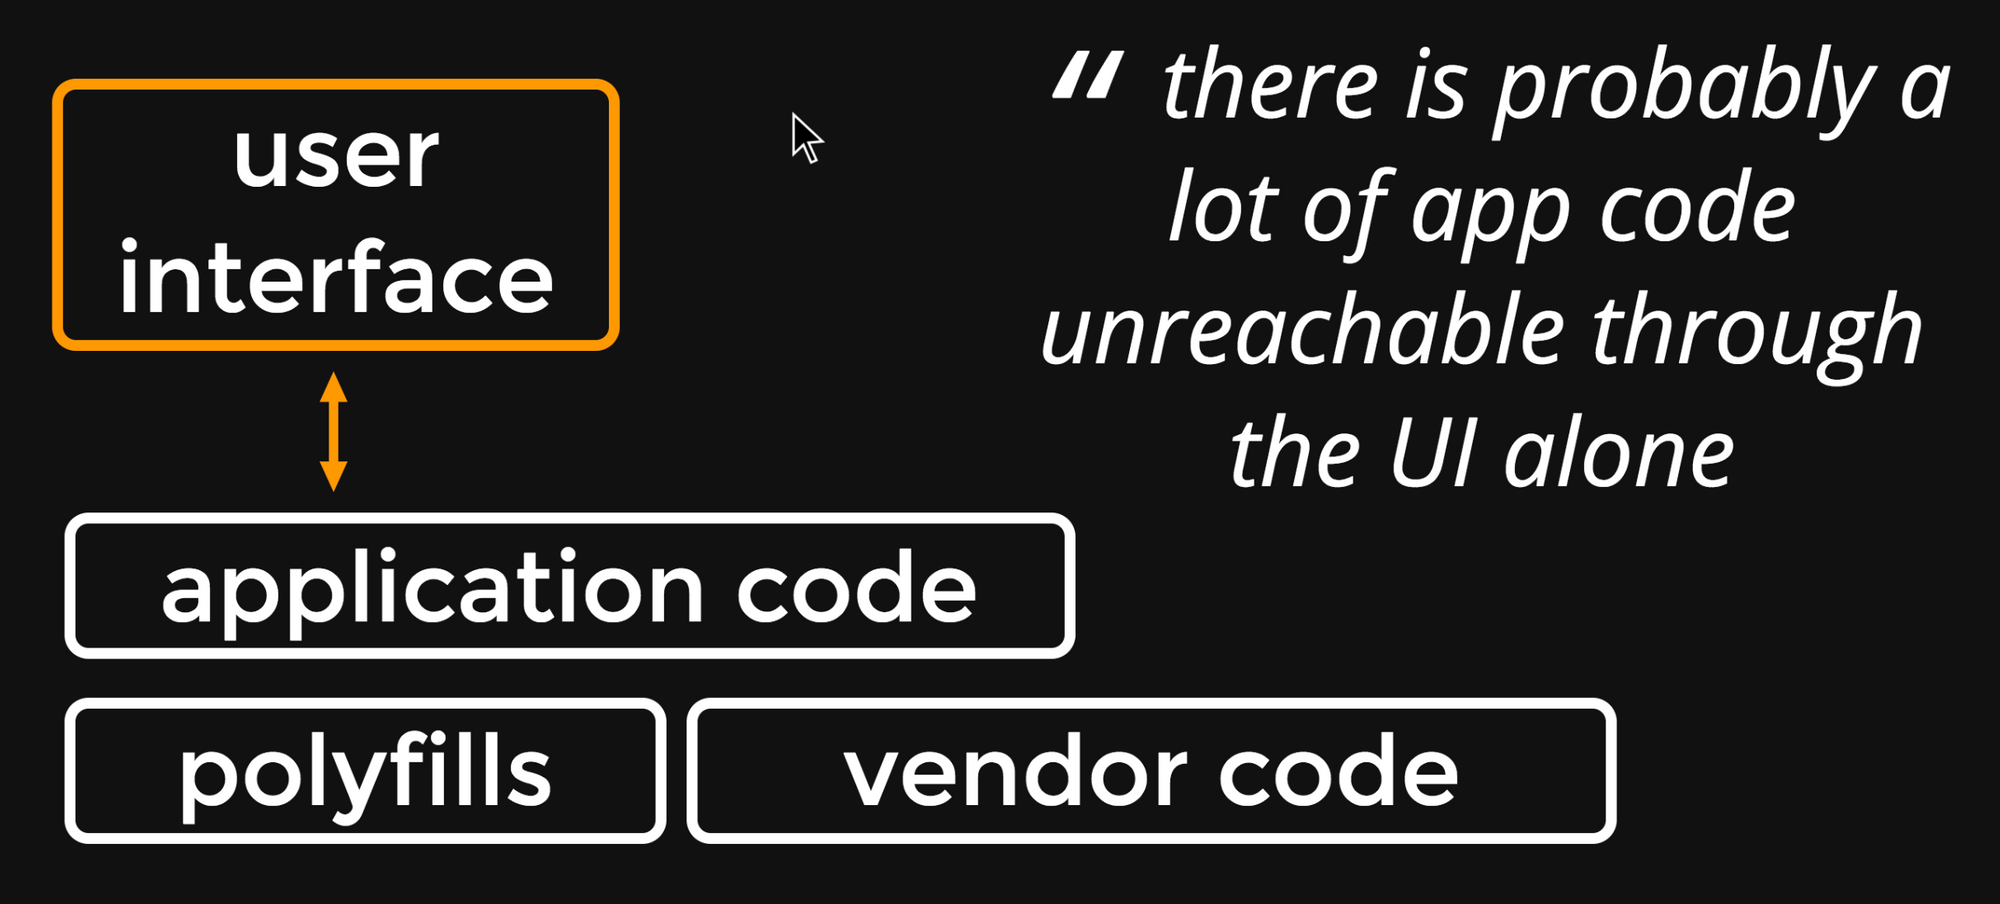
This about all the application code that handles the edge cases, all the vendor libraries and all polyfills. The “normal” happy and error paths that the user can take through the web application are probably just a fraction of all code bundled in the browser. So code coverage and data coverage are going to be widely misleading metrics.
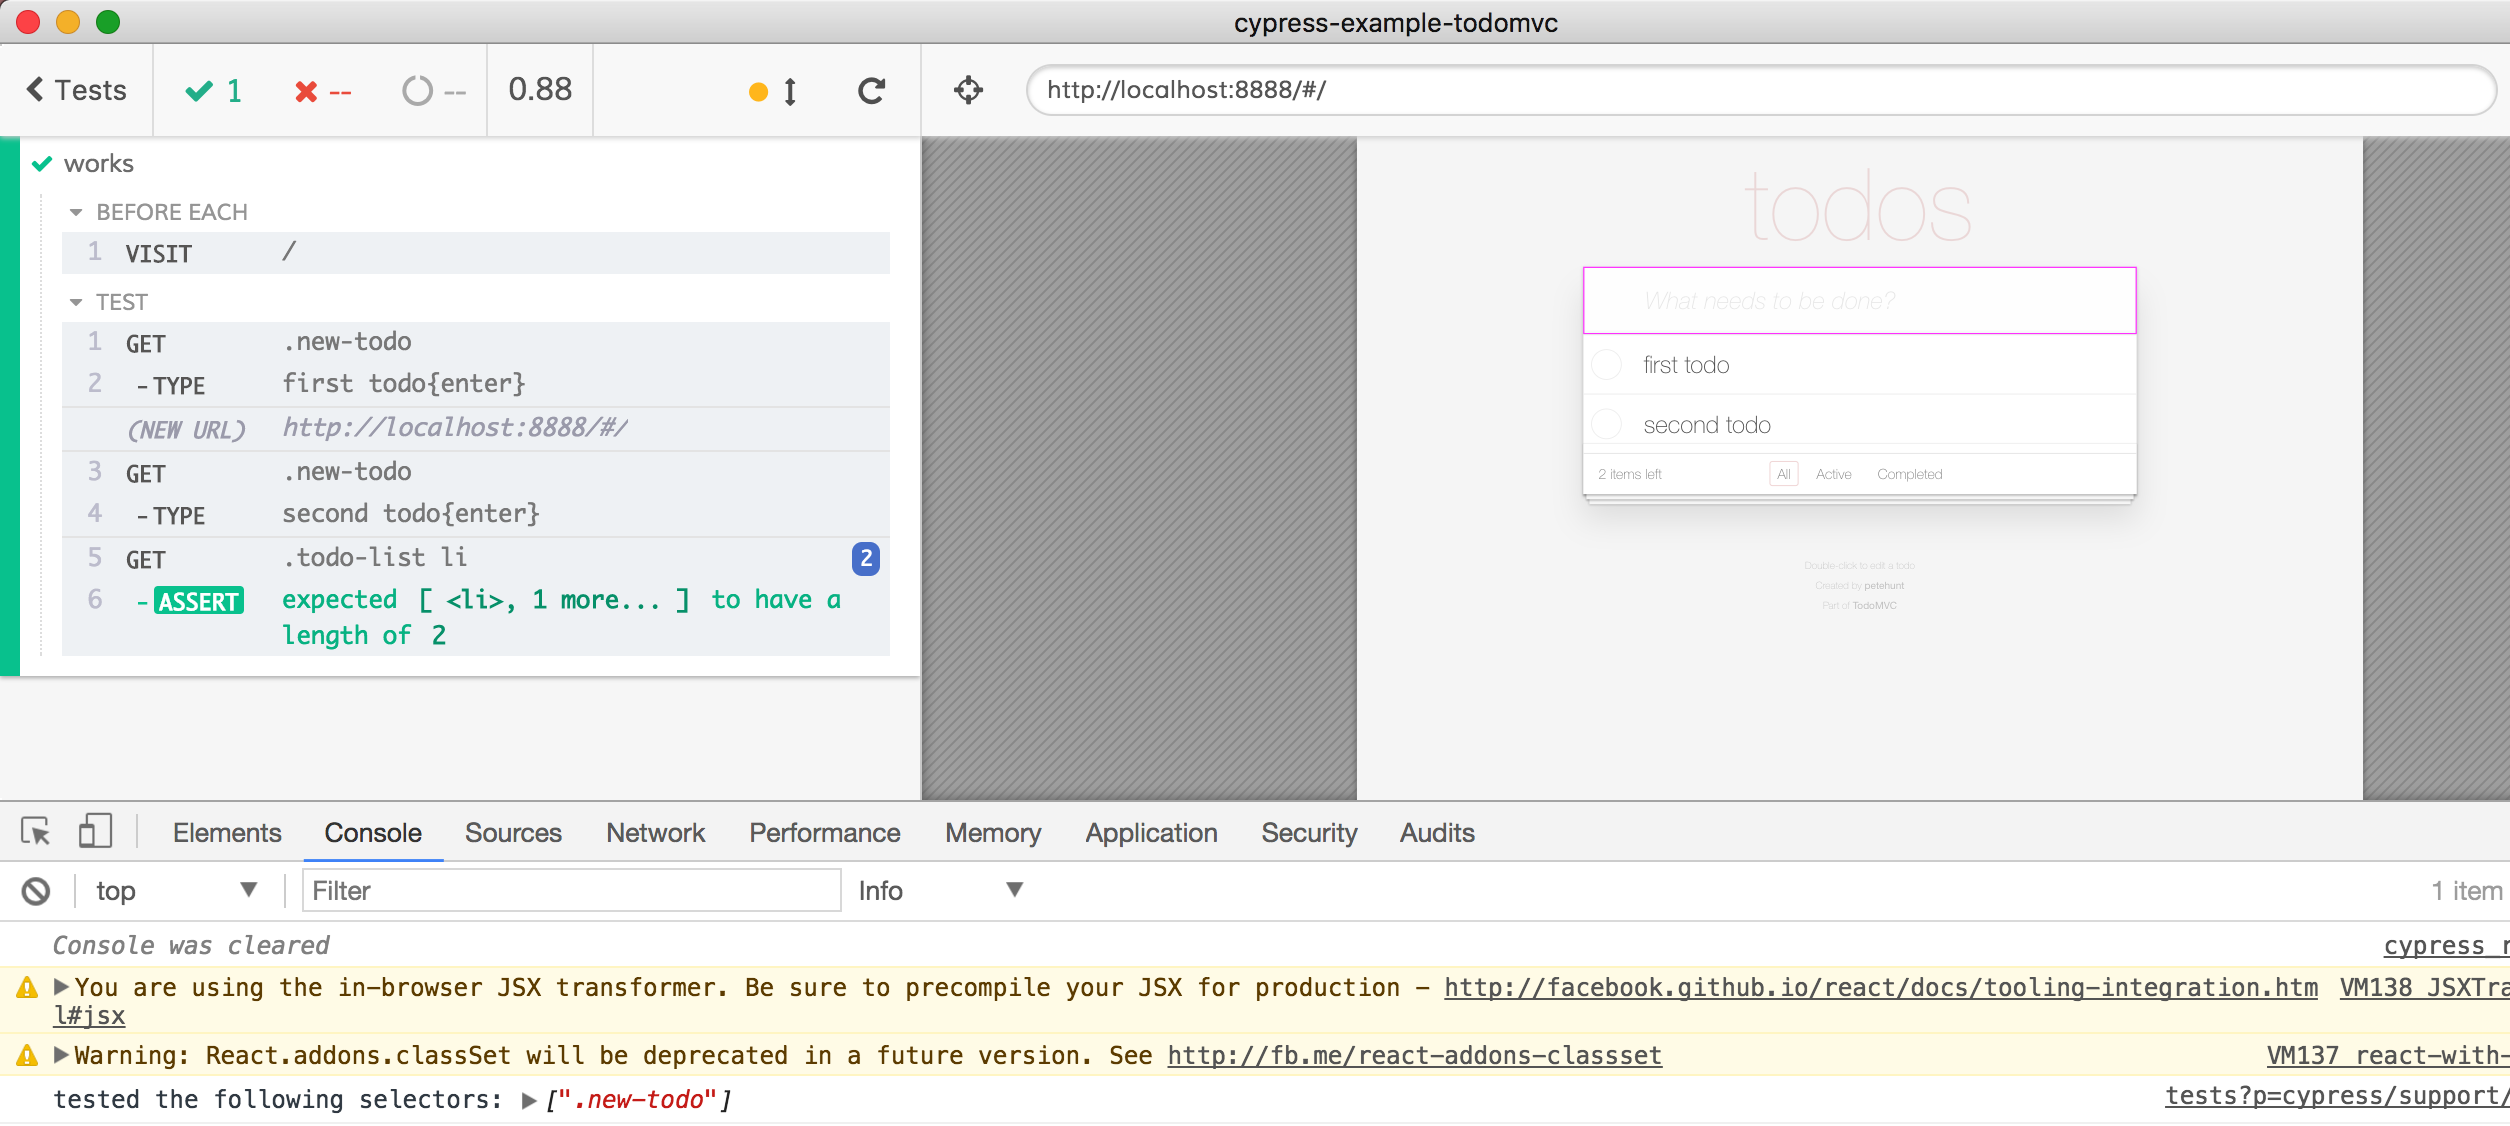
Yet we understand the appeal of a simple, single number to express how well the web application has been tested. So as an idea we are thinking about the test coverage as all the page elements the tests have interacted with. For example, in a typical TodoMVC application we might have a test like this:
beforeEach(() => {
  cy.visit('/')
})
it('works', function () {
  cy.get('.new-todo').type('first todo{enter}')
  cy.get('.new-todo').type('second todo{enter}')
  cy.get('.todo-list li').should('have.length', 2)
})
From reading the test code it should be clear: the test enters 2 todo items and then checks that there are 2 todo items in the displayed list. What does this test cover on the page? We can modify Cypress command behavior and track every seen element. For example we can overwrite cy.track command, to remember the selector of the input element the test typed into.
let seenSelectors = []
// just adds element selector to the
// list of seen elements
const rememberSelector = (selector) => {
  seenSelectors.push(selector)
}

Cypress.Commands.overwrite('type',
  (type, $el, text, options) => {

  rememberSelector($el)

  return type($el, text, options)
})
When the tests run, every element that we typed into will be remembered. After the tests complete we can highlight these elements and take a screenshot.

More importantly we can see all page elements NOT covered by the test!
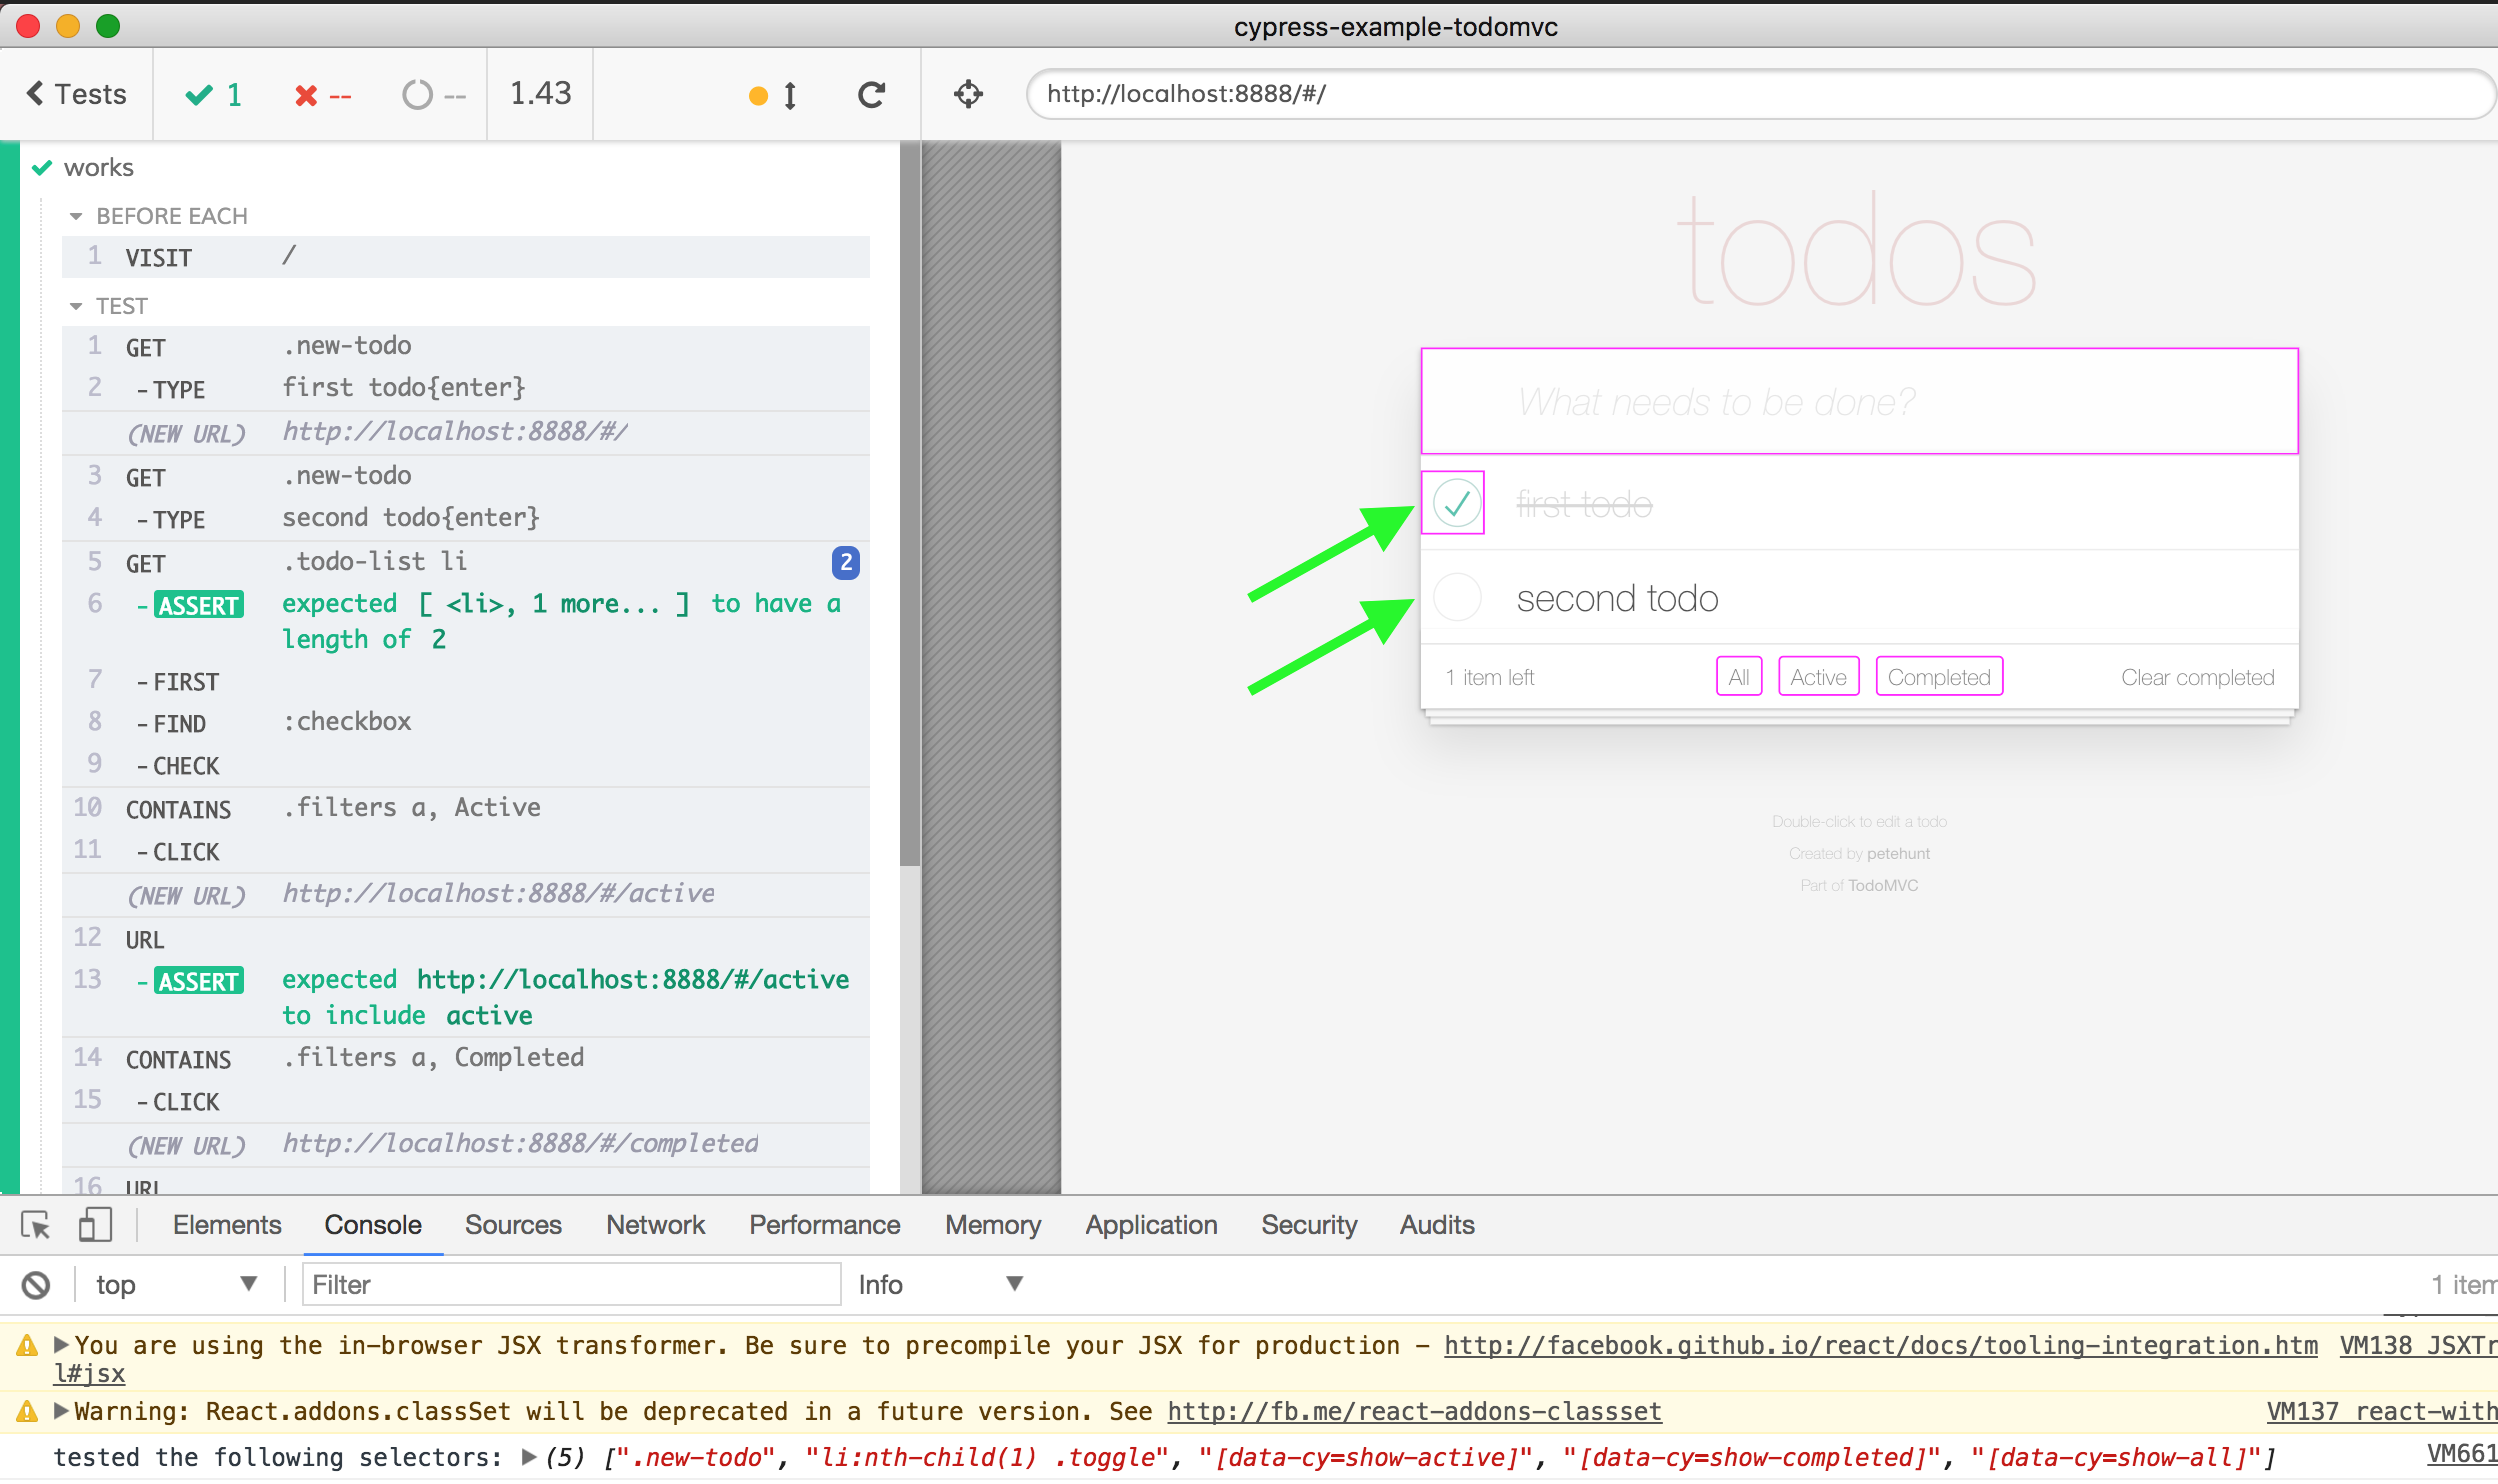
The test does not check todo items as completed, and never uses filter links at the bottom. We can write more tests or extend the above test to cover those elements. For example this longer test should be enough
beforeEach(() => {
  cy.visit('/')
})
it('works', function () {
  cy.get('.new-todo').type('first todo{enter}')
  cy.get('.new-todo').type('second todo{enter}')
  cy.get('.todo-list li').should('have.length', 2)
    .first().find(':checkbox').check()

  cy.contains('.filters a', 'Active').click()
  cy.url().should('include', 'active')

  cy.contains('.filters a', 'Completed').click()
  cy.url().should('include', 'completed')

  cy.contains('.filters a', 'All').click()
  cy.url().should('include', '#/')
})
Click on the video below to see the tests run and then show all the tested elements highlighted
From the video we can see that our test does not cover the “Clear completed” button that appears when there is at least a single completed todo item in the list.
We should extend the test to cover that page element too!
Element coverage shortcomings
It is nice to see which elements the end-to-end tests have interacted with. But even in this early proof of concept stage we see its limitations. For example, we have clicked on the first todo item’s checkbox to mark it complete. But this is no different from clicking on the second todo item’s checkbox - they both do essentially the same thing.
So we need to “teach” element coverage that covering one of these elements is enough.
The second problem is more subtle and deeper. It is also shown by the checkbox. In our element coverage image, the checkbox is shown as covered because there was cy.check() on it. When the checkbox is checked, the Todo item is set to complete: true. Yet the user is allowed to make a completed item incomplete again. But how do we show that both “check” and “uncheck” interactions were tested? It will be the same element on the page, but just going from one state to another and then back again.
Hopefully we can come up with some answers to these questions!
Further reading
- this blog post is based on the slide deck Test Coverage Update: State of Testing.
- the source code for this blog post is in the recipe Element Coverage
- if you want to see how this idea develops, follow Cypress @cypress_io on Twitter and subscribe to this blog’s Atom feed