
End-to-end tests can be extremely effective at covering a lot of your application's code. Even a single realistic test, because it loads and exercises the entire application, can cover 60-70% of the statements.
Introduction
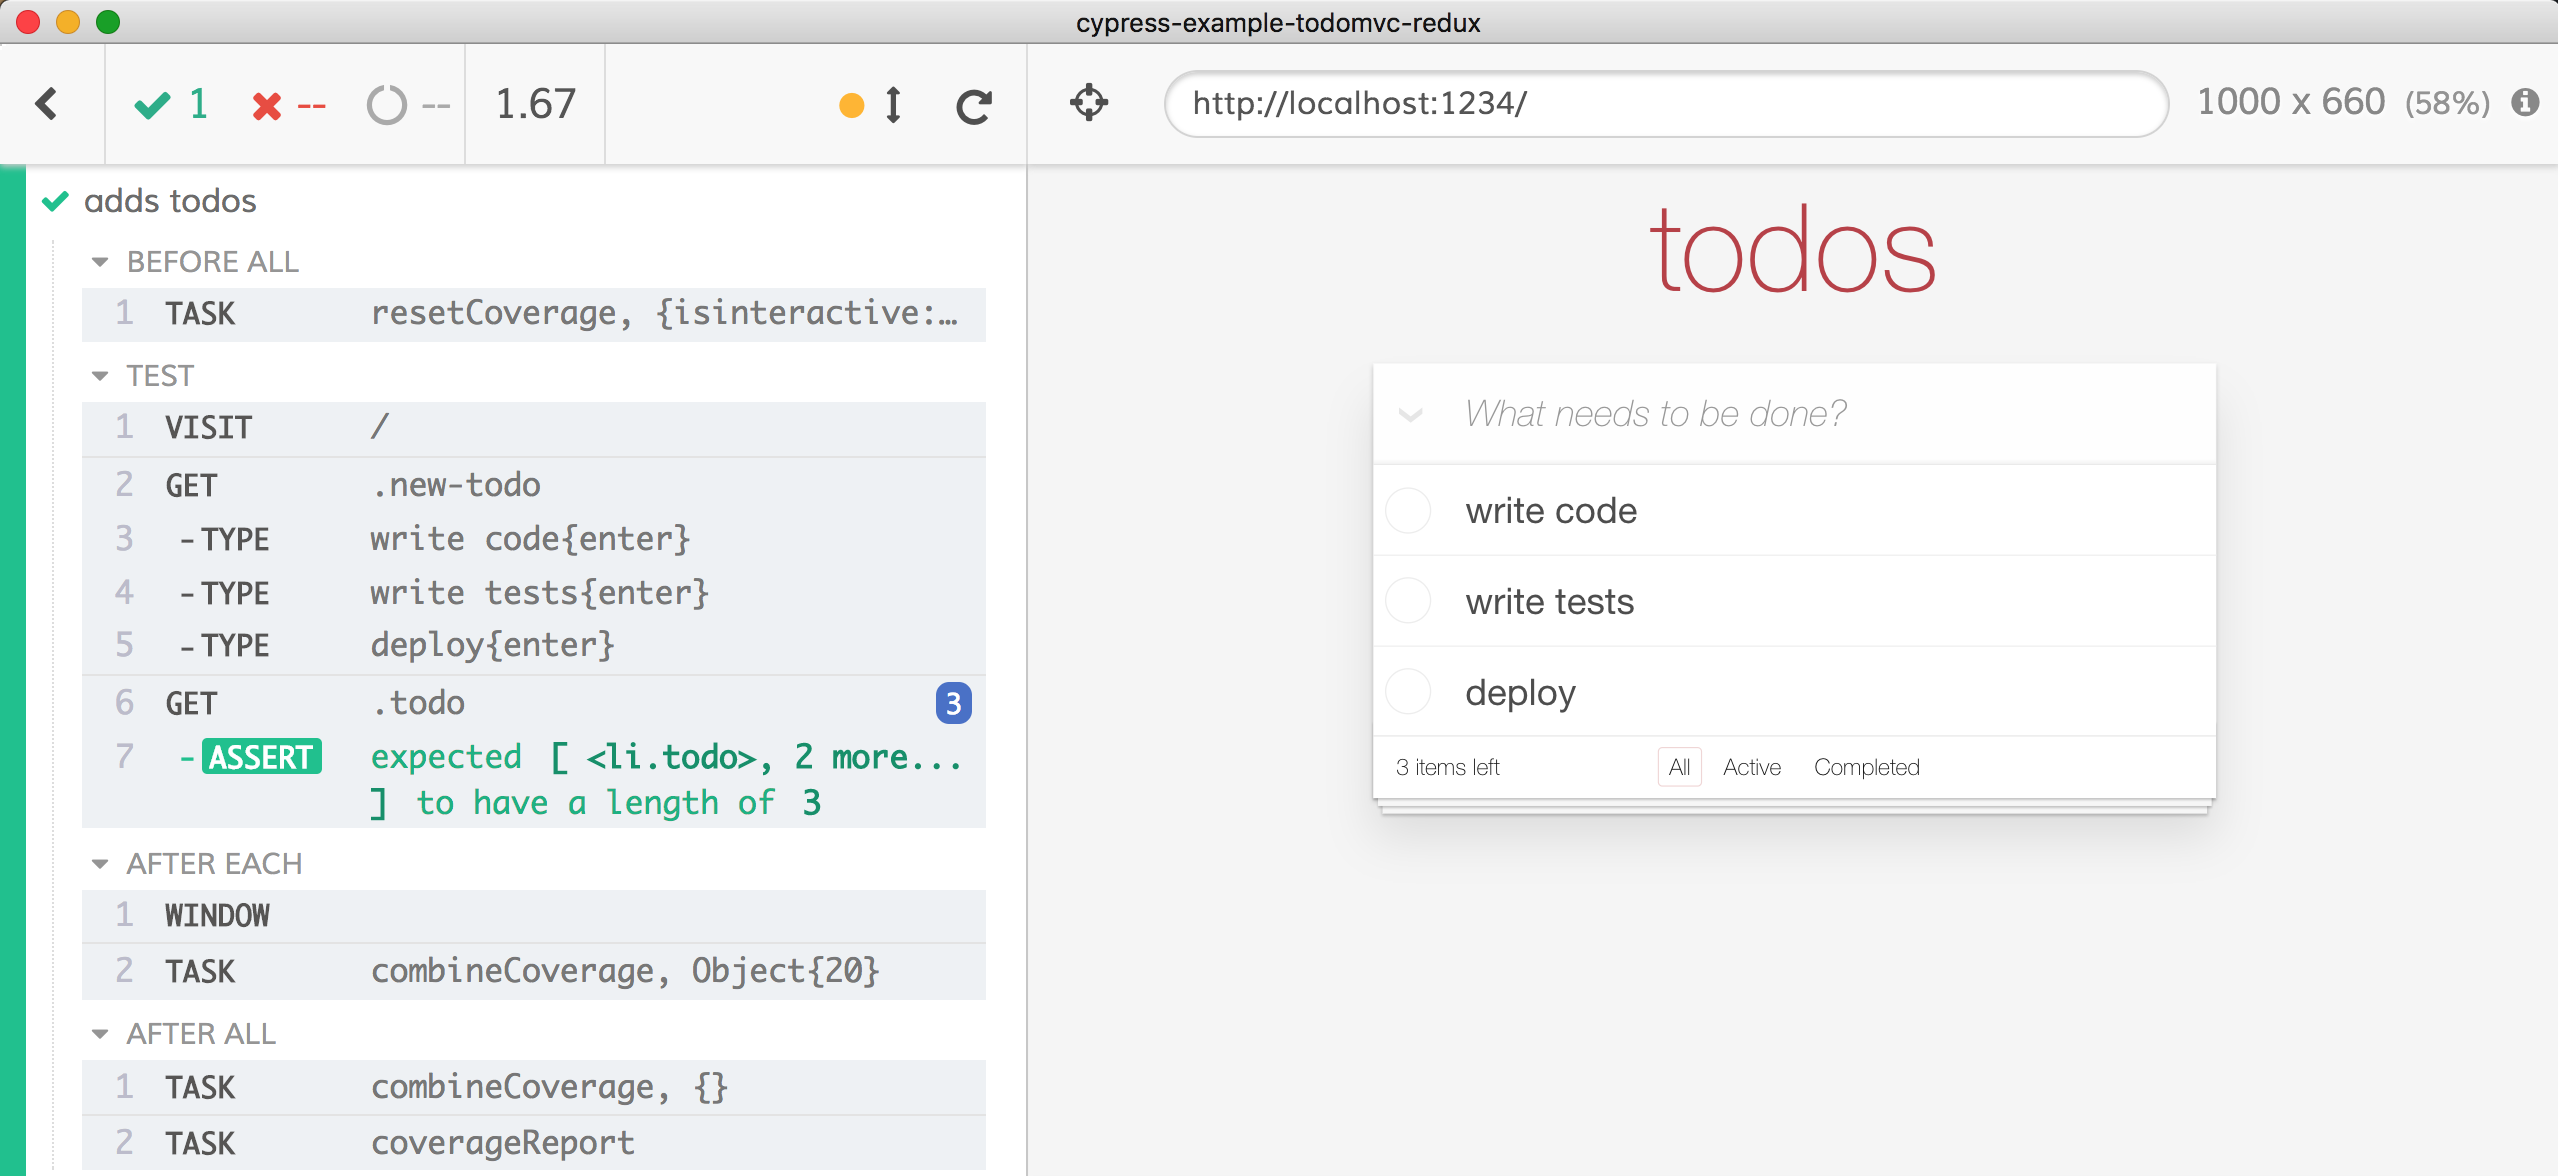
Let's look at a concrete example in the cypress-example-todomvc-redux repository. The spec cypress/integration/first-spec.js has a single test "adds todos" that covers 72.6% of the source code with just a few commands.
it('adds todos', () => {
  cy.visit('/')
  cy.get('.new-todo')
    .type('write code{enter}')
    .type('write tests{enter}')
    .type('deploy{enter}')
  cy.get('.todo').should('have.length', 3)
})
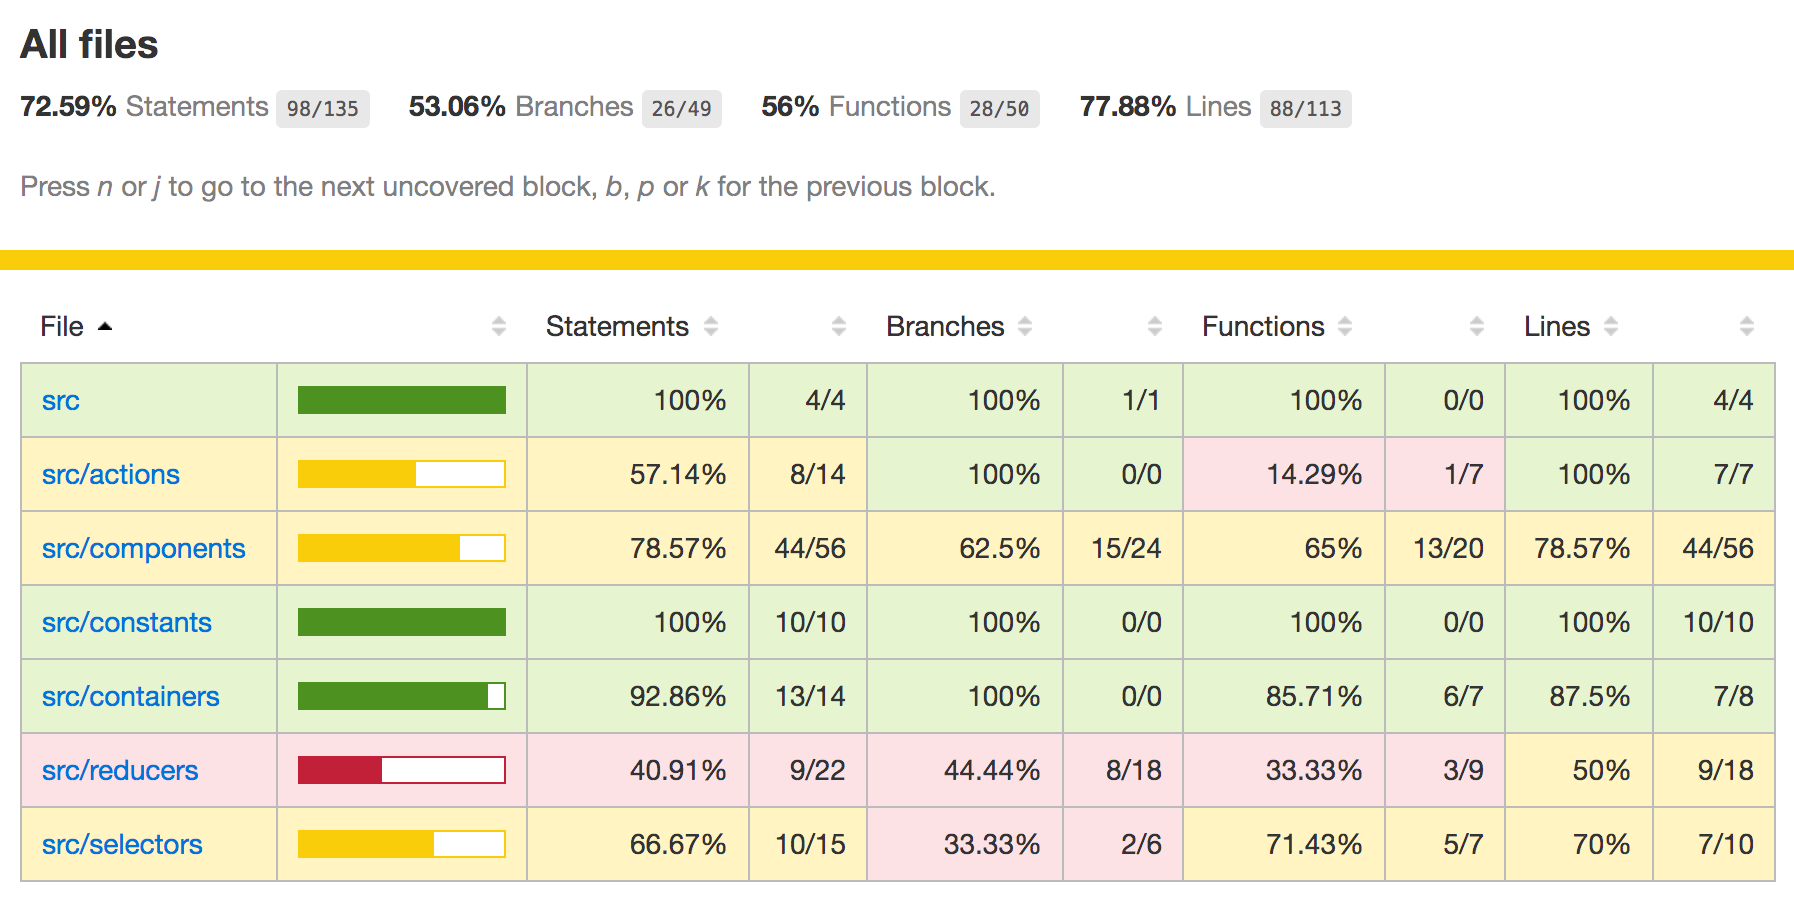
After the test completes, the report is saved in the coverage/lcov-report folder. The report is a static HTML site that one can open directly in the browser using command open coverage/lcov-report/index.html.
By adding more end-to-end tests, we can quickly get to 90%-99% code coverage. Sometimes source lines in the code cannot be reached from an end-to-end test that operates through the User Interface. Then you can write a unit test, run it in Cypress, and fill the code coverage "gaps", achieving 100% code coverage.
We have documented how to get the code coverage from Cypress tests in our Code Coverage Guide. In this blog post I will show how to display the code coverage number and HTML report if you are running end-to-end tests on GitLab CI.
GitLab CI example
I have set up GitLab CI to run Cypress tests in https://gitlab.com/cypress-io/cypress-example-todomvc-redux project. After the tests finish and the coverage information has been saved, I call a command to display the coverage text summary which prints to the terminal like this:
$ npx nyc report --reporter=text-summary

==== Coverage summary ============
Statements   : 72.59% ( 98/135 )
Branches     : 53.06% ( 26/49 )
Functions    : 56% ( 28/50 )
Lines        : 77.88% ( 88/113 )
==================================
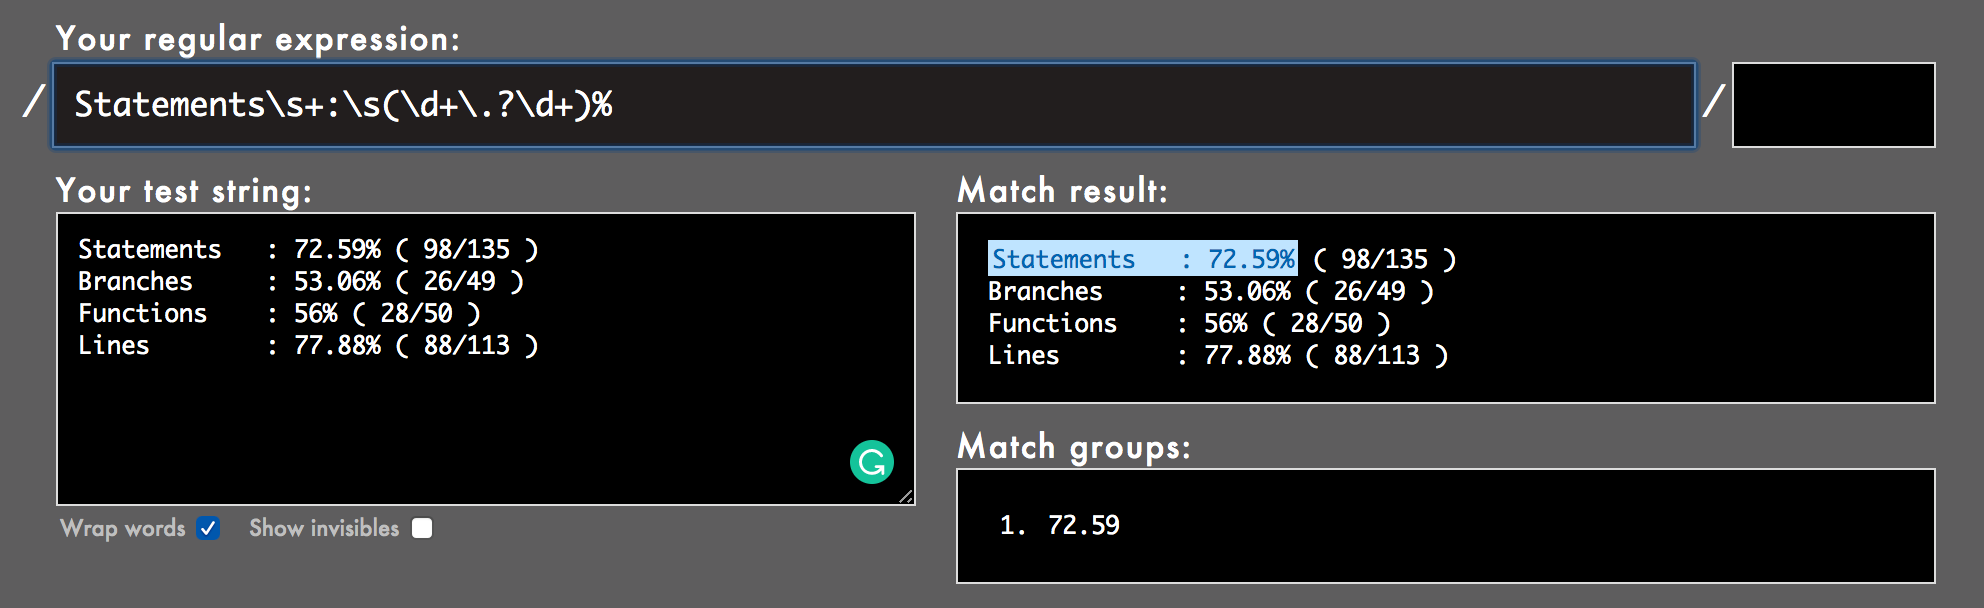
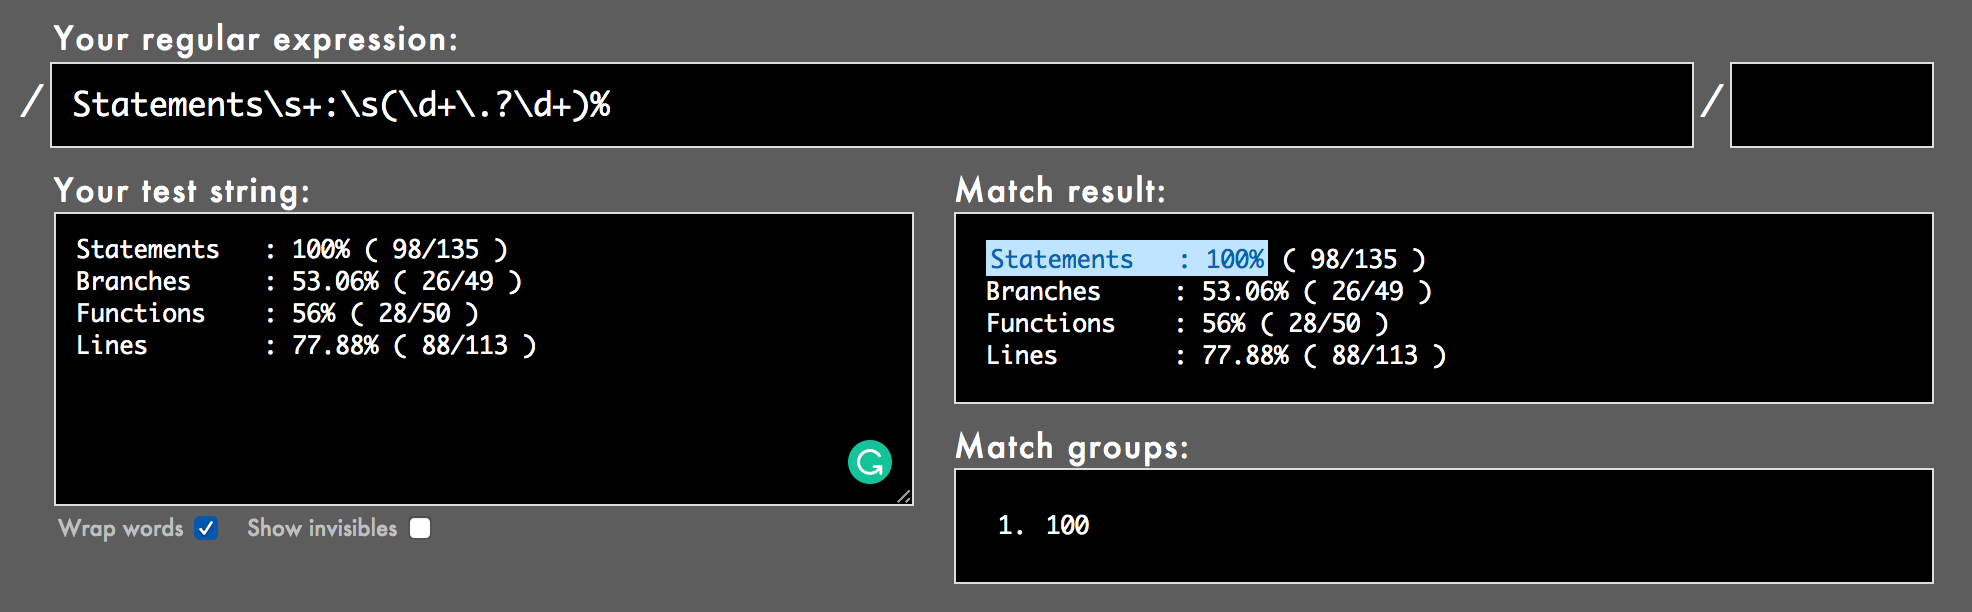
GitLab CI can detect the Statements : XX.YY% code coverage number using a regular expression /Statements\s+:\s(\d+.?\d+)%/, see GitLab CI Pipeline doc. Just to be safe, I have tested the regular expression against several code coverage numbers using https://rubular.com/ page.
Here is the entire configuration file so far; it configures caching, runs the tests and prints the code coverage summary.
# to cache both npm modules and Cypress binary we use environment variables
# to point at the folders we can list as paths in "cache" job settings
variables:
  npm_config_cache: "$CI_PROJECT_DIR/.npm"
  CYPRESS_CACHE_FOLDER: "$CI_PROJECT_DIR/cache/Cypress"

# cache using branch name
# https://gitlab.com/help/ci/caching/index.md
cache:
  key: ${CI_COMMIT_REF_SLUG}
  paths:
    - .npm
    - cache/Cypress

# this job installs NPM dependencies and Cypress
test:
  image: cypress/base:10
  script:
    - npm ci
    # check Cypress binary path and cached versions
    # useful to make sure we are not carrying around old versions
    - npx cypress cache path
    - npx cypress cache list
    - npm run cypress:verify
    # start the server, wait for it to respond, then run Cypress tests
    - NODE_ENV=test npm test
    # print coverage summary so that GitLab CI can parse the coverage number
    # from a string like "Statements   : 100% ( 135/135 )"
    - npx nyc report --reporter=text-summary
  artifacts:
    when: always
    paths:
      # save both cypress artifacts and coverage results
      - coverage
      - cypress/videos/**/*.mp4
      - cypress/screenshots/**/*.png
    expire_in: 10 days
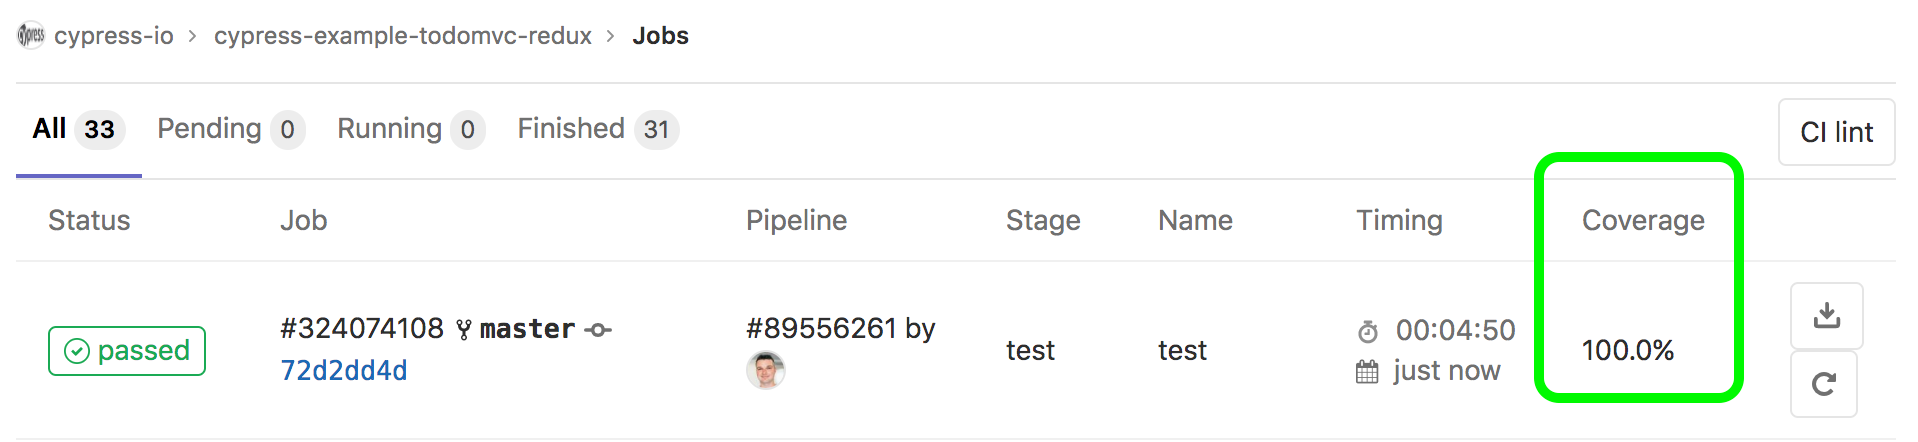
The tests pass on GitLab CI and the coverage number is shown in the "Jobs" page in its own column, see cypress-example-todomvc-redux/-/jobs
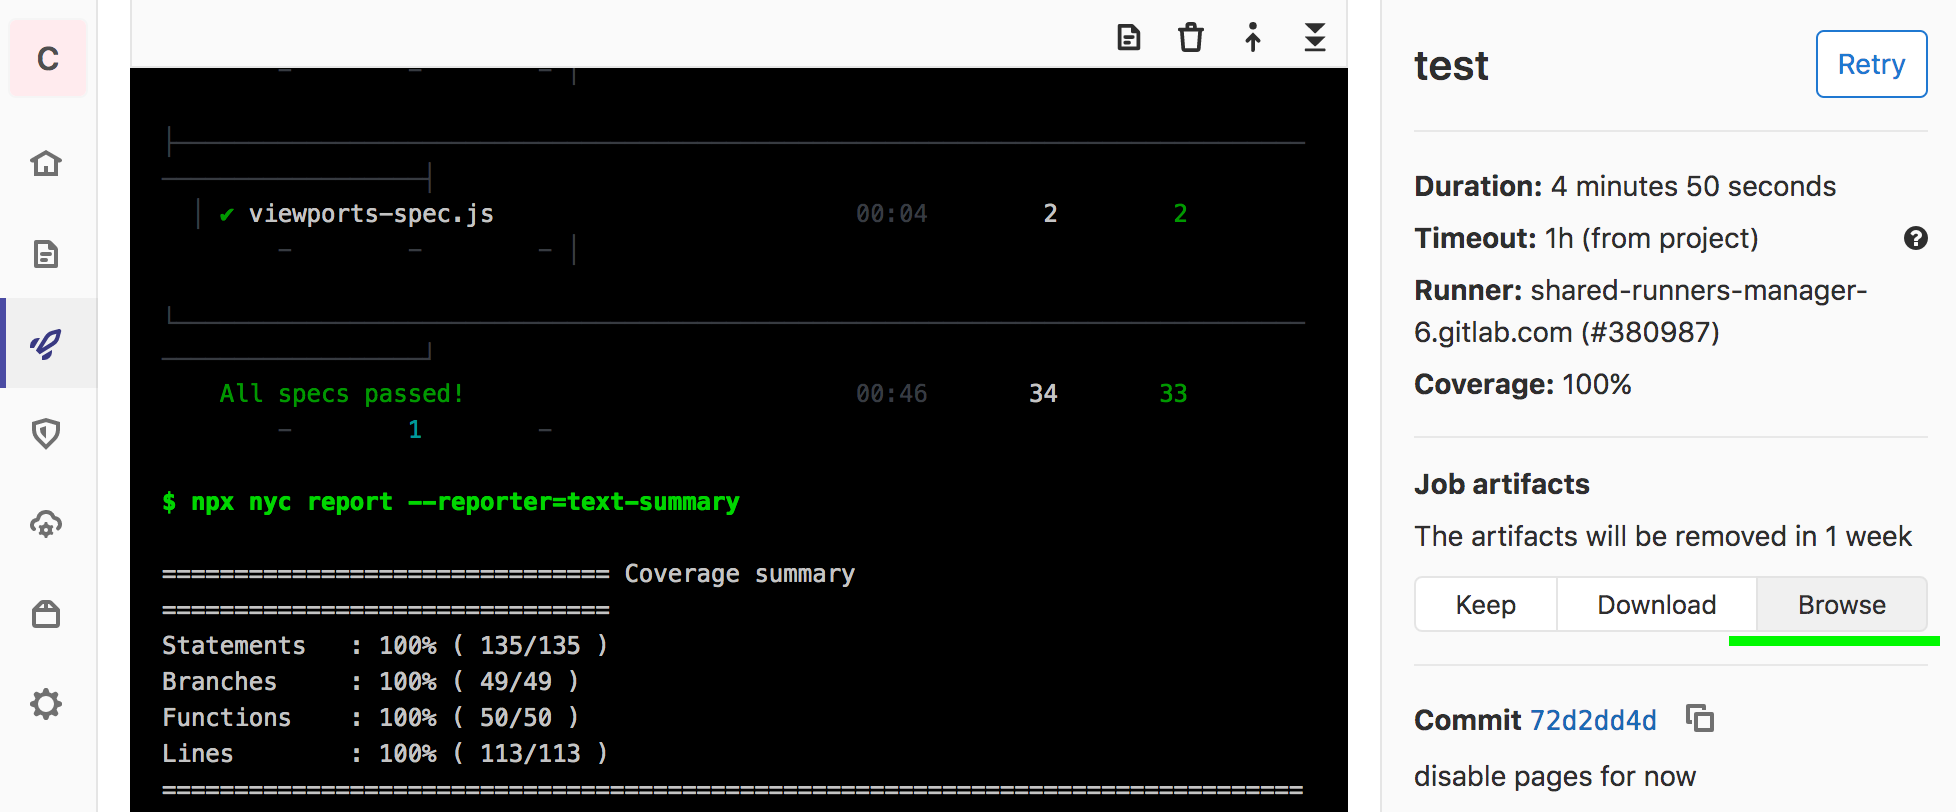
The coverage HTML report is available under job's artifacts, where we can browser and see the individual file numbers.
Publish HTML coverage report
GitLab CI also includes static Pages hosting, which can be used to Publish coverage report. Let's set it up. I will add a second job that will run after the tests finish.
test:
  # test job as before

# store and publish code coverage HTML report folder
# https://about.gitlab.com/blog/2016/11/03/publish-code-coverage-report-with-gitlab-pages/
# the coverage report will be available both as a job artifact
# and at https://cypress-io.gitlab.io/cypress-example-todomvc-redux/
pages:
  stage: deploy
  dependencies:
    - test
  script:
    # delete everything in the current public folder
    # and replace with code coverage HTML report
    - rm -rf public/*
    - cp -r coverage/lcov-report/* public/
  artifacts:
    paths:
      - public
    expire_in: 30 days
  only:
    - master
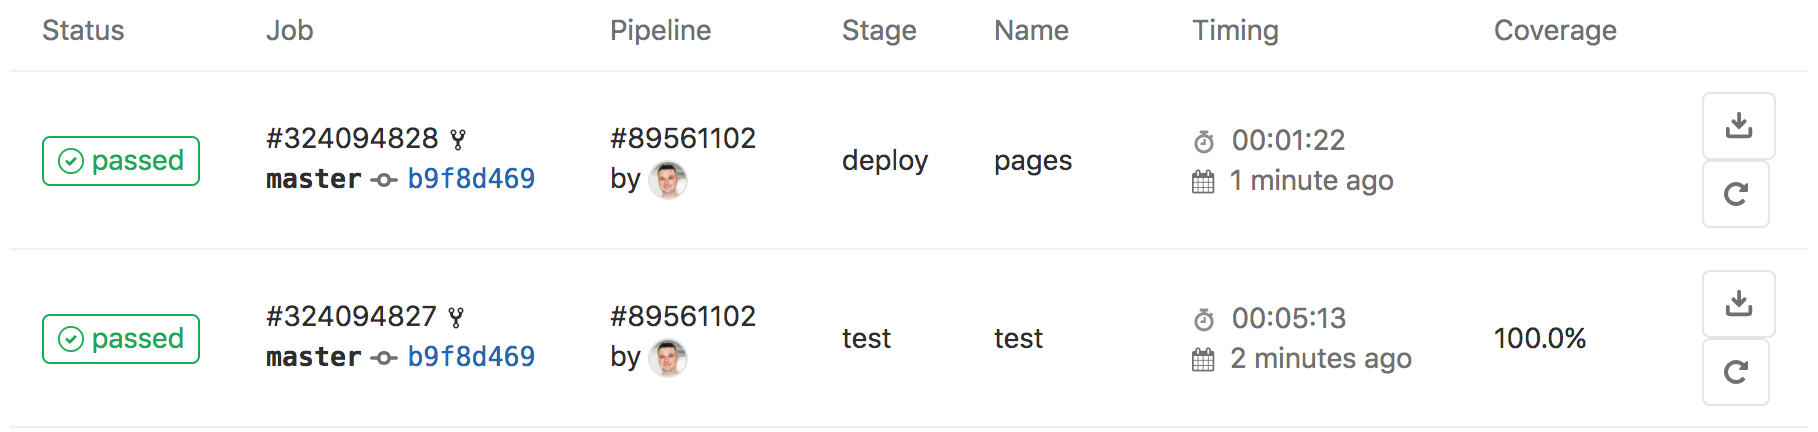
When the pipeline runs, the test job has code coverage, and the pages job does not.
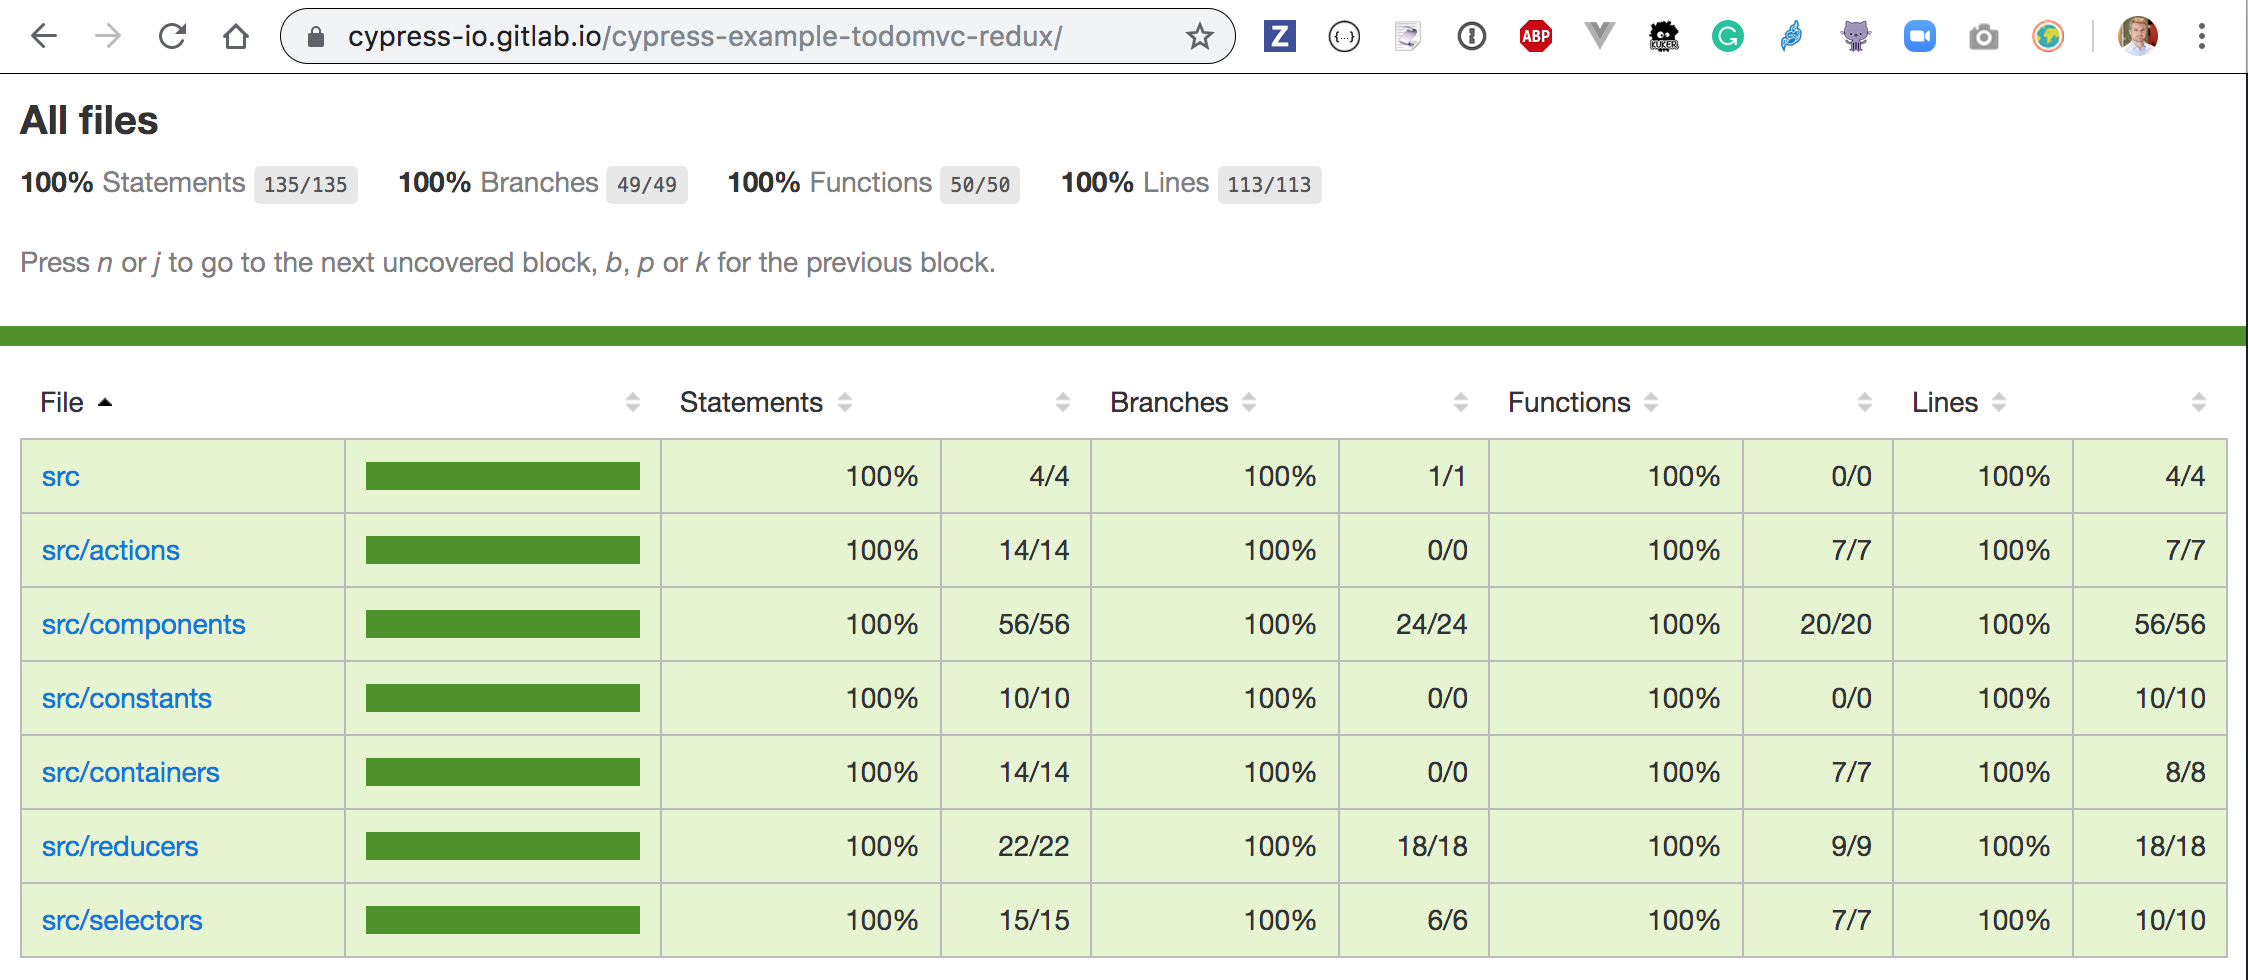
But the pages job does deploy static HTML coverage report, which you can see at https://cypress-io.gitlab.io/cypress-example-todomvc-redux/
See more
- Cypress code coverage guide
- Example cypress-example-todomvc-redux repo
- Complete code coverage with Cypress webcast