Today, we’re excited to announce the release of new features designed to improve your experience of finding and debugging tests with Cypress Dashboard.
In this release, all Cypress Dashboard users have access to new popular, community-requested features:
- Shortcuts to recently updated branches on the Projects page
- Enhanced error details for failed runs
- Current run status as a browser favicon
Accessing your most recent tests just got easier
The new Projects page in Cypress Dashboard now displays your organization’s projects with shortcuts to relevant branches and their most recent test runs.
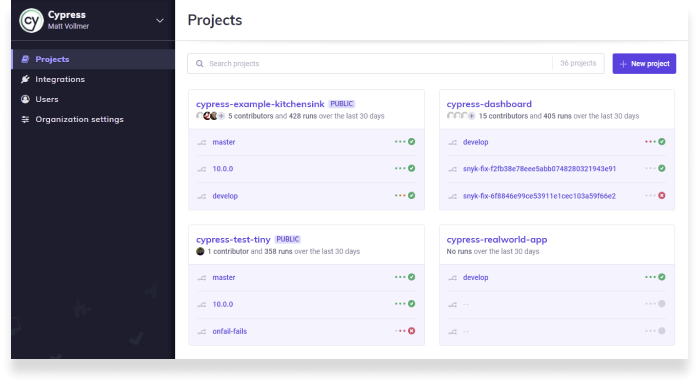
Within each project, the project’s default branch is always displayed first, followed by the two branches with the most recently recorded runs. Each branch is also accompanied by a status preview of the branch’s last four recorded runs. This is useful when quickly scanning projects for failed tests.
At a glance, you can also see how many contributors and test runs each project had during the last 30 days.
After clicking a branch shortcut from the Projects page, you will be immediately directed to that branch’s latest run results.
Keep an eye out for upcoming releases designed to surface more efficient branch-based workflows.
Diagnose test failures faster with enhanced error details
For every test run, Cypress Dashboard tracks which tests fail and, most importantly, which errors lead to test failures.
Newly released interactive error details on the Run Overview page mean that you can now see additional context about each error, including precisely where the error occurred in each failed test.
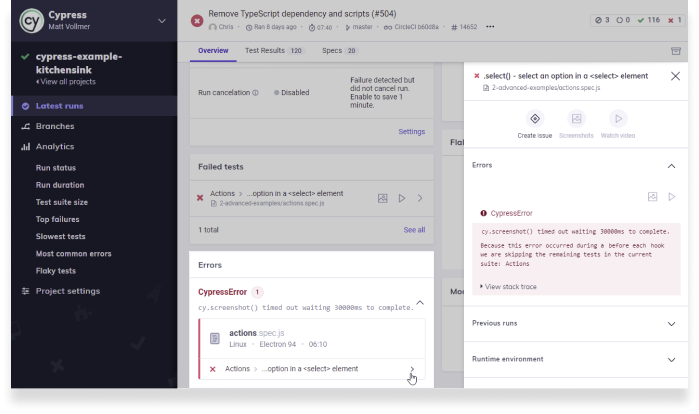
With this update, you can now expand error details and view the exact line of code in your test spec file that led to the failure, browser screenshots and videos of your application's failure state, and the historical performance of the failed test. All directly from the Run Overview page.
With this improved workflow, you will spend less time searching for errors and more time diagnosing and troubleshooting them.
New favicons! Have you noticed?
A few weeks ago we silently rolled out another frequently requested feature, because sometimes it’s the little things that matter. In this case, new Cypress Dashboard favicons.

You can now check the status of your test runs at a glance. Any open browser tab that displays the Run Overview page for completed or in-progress test runs now displays a favicon indicating the run’s current status.
New favicon statuses include:
- Running
- Passed
- Failed
Do you have feedback about new features we recently released? Drop us a note!
Not using Cypress Dashboard yet?
The Cypress Dashboard adds a layer of timely, simple, and powerful insights to all your test runs in a single, easy-to-use Dashboard. Test and debug faster with the Cypress Dashboard. Get started for free.