In case you missed it, in another recent release, we rolled out an update to the Projects page to give you a quicker path to your projects' most recently updated branches. If you haven't noticed yet, give it a look.
Today, we're here to share another Cypress Dashboard feature that is aimed at surfacing your projects' most relevant branches.
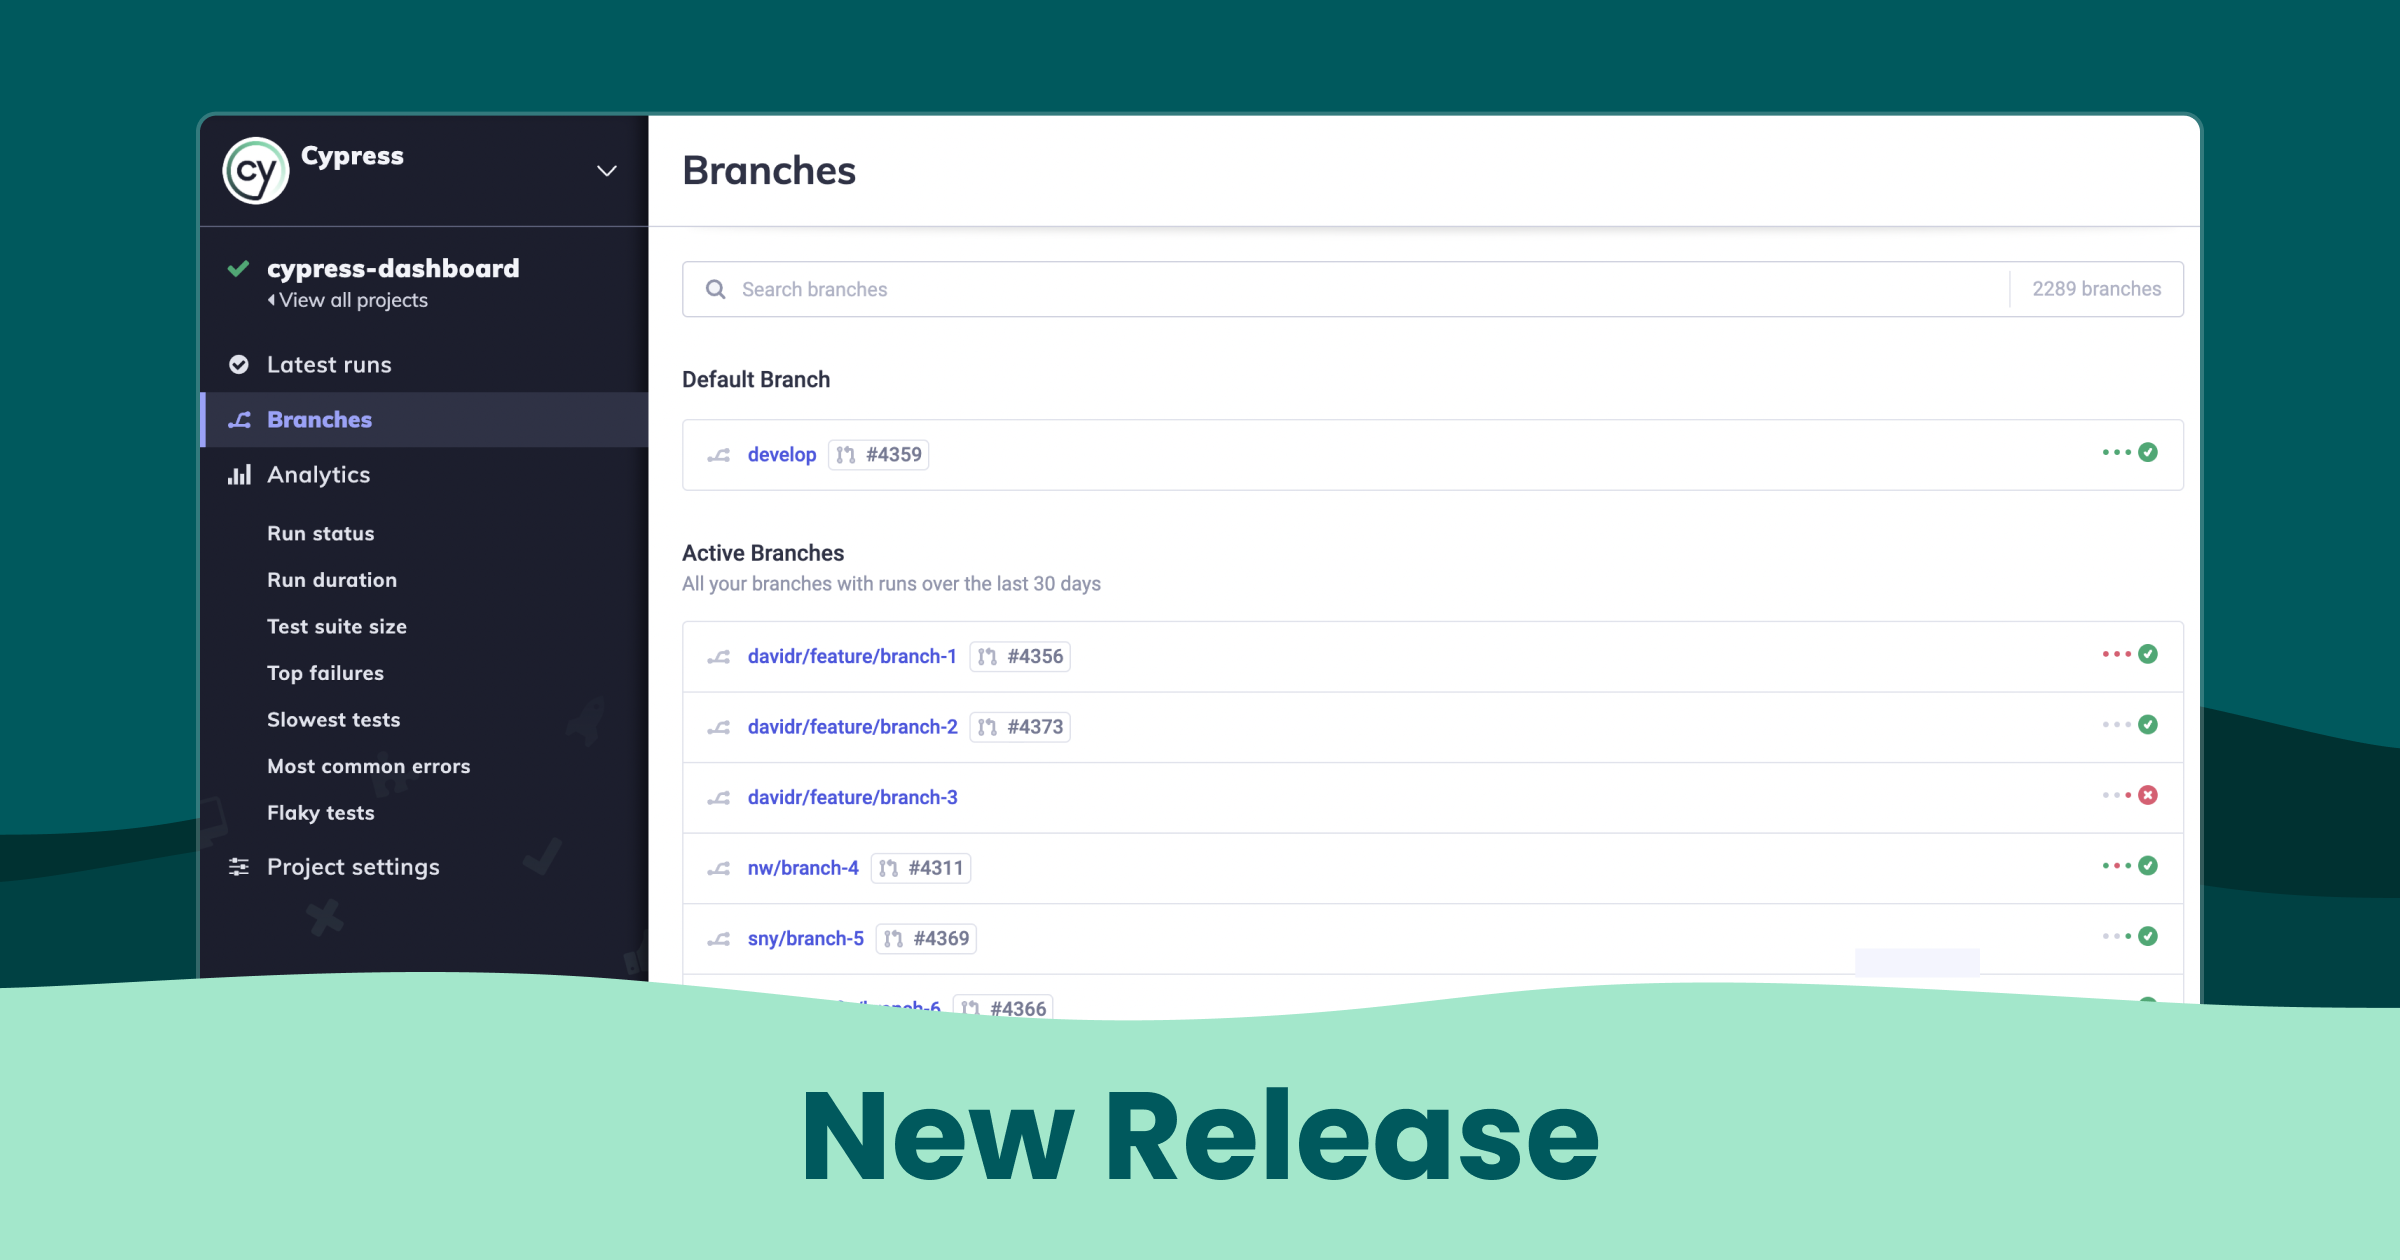
Dashboard's new Branches page can be found after navigating into any of your projects. Whether you're reviewing your latest runs, debugging a specific test, or reviewing analytics, a link to the Branches page will always be accessible in Dashboard's left navigation.
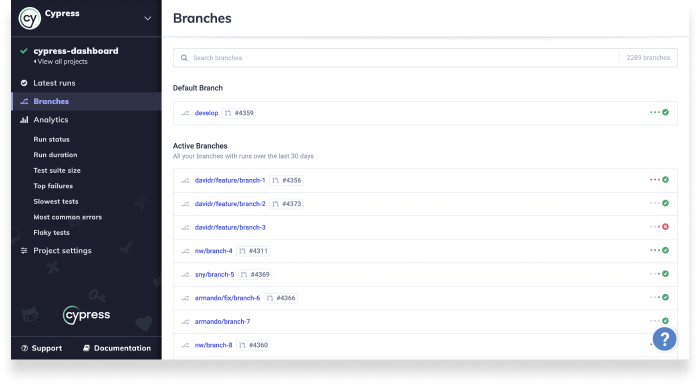
On the new Branches page, you will find your project's default, active, and stale branches ordered by the most recent activity. Active branches include any branches that recorded test runs within the last 30 days.
You also have high-level visibility into the recent health of your project's branches. Each branch displays the results of the last 4 test runs, with the most recent test run result being represented by a visible green passing icon or a red failing icon.
Cypress Dashboard is a powerful addition to CI pipelines. Our goal is to deliver a user experience that is familiar and is equally as powerful as the efficiencies and insights that Dashboard provides. This release is the early foundation of branch-based workflow improvements that are yet to come.
If this feature is helpful, or if you have other ideas for other features that would help you, let us know.
Not using Cypress Dashboard yet?
The Cypress Dashboard adds a layer of timely, simple, and powerful insights to all your test runs in a single, easy-to-use Dashboard. Test and debug faster with the Cypress Dashboard. Get started for free.